hero trace
Shows what each agent session did: its tool calls, model calls, refusals, tokens and estimated cost.
What hero trace does
It answers one question: what did my agent actually do? It reports on the sessions recorded on your machine over the last 30 days, with sessions that had problems first. You can replay one session step by step, or list the newest policy violations.
- Use it when you want to see what an agent did, find a refused or failed step, or replay one session.
- Use something else when you want job results (
hero verdict), which model served each call (hero route), or one read across your agents with fixes (hero health). - Alias:
hero trace <id>is short forhero trace show <id>. - Reads or changes:
status,list,showandviolationsread. Nothing here changes your work, and a trace read never sends a usage beacon.
Cost marked ~ is an estimate at public list prices, or at your own rate card when HERO_BILLING_RATES points at one. Runs of hero setup and hero ask are left out of the table.
Synopsis for hero trace
hero trace [status] [--json] [--details]
hero trace list [--all] [--json] [--details]
hero trace show <id> [--json] [--details]
hero trace <id>
hero trace violations
hero trace describe [--json]
hero trace help
Run with no subcommand, it behaves as status. hero trace --all is the same as hero trace list --all.
Subcommands of hero trace
| Subcommand | What it does | Reads or changes |
|---|---|---|
status | Totals for the window, then the five sessions that need attention first, with the command to replay the top one. This is the default. | Reads |
list | Sessions in the window, newest first: the newest 25, or every retained session with --all. | Reads |
show <id> | Replays one session, trace or job, step by step. | Reads |
violations | The newest policy violations, each with its target, rule, reason and id. hero trace violations includes recorded refusals from your rules files; use hero govern for the governance decision and hero enforce for the rule's enforcement state. | Reads |
describe | The command's own descriptor. Reads none of your data and sends no beacon. | Reads |
help | This command's help. Same as --help and hero help trace. | Reads |
Arguments for hero trace
Arguments for status and list
| Argument | Type | Required | Default | What it does |
|---|---|---|---|---|
--all | Flag, for list | No | Off, newest 25 | Shows every retained session in the window. On its own, hero trace --all runs list --all. |
--json | Flag | No | Off | Machine-readable output with data and envelope. list --json adds next_cursor, and returns the facts rather than the table. |
--details | Flag | No | Off | Shows every shared number as numerator/denominator, with the reasons a figure is partial. |
Arguments for show
| Argument | Type | Required | Default | What it does |
|---|---|---|---|---|
<id> | A session, trace or job id | Yes | None | The session to replay. Take it from the Run: line or the session column of hero trace, or the id: line of hero trace violations. It matches a session id first, then an exact trace or job id, then a unique prefix of six or more characters. An ambiguous prefix lists up to 10 matching ids. The short form hero trace <id> works only when the id is lowercase hex digits and dashes, at least six characters. |
--json | Flag | No | Off | The same steps as machine-readable output, with data and provenance. |
--details | Flag | No | Off | Adds the raw span list, the line naming the record it read, and the rate card version. |
Arguments for violations
None. It lists the newest 20. --json is accepted and ignored.
How hero trace gets its record
Ekamyth Agent OS records each session on your machine as your agent works: its own tool calls. hero trace reads that record, prices model calls against the rate card, and prints the result. For the whole picture, see How observability works.
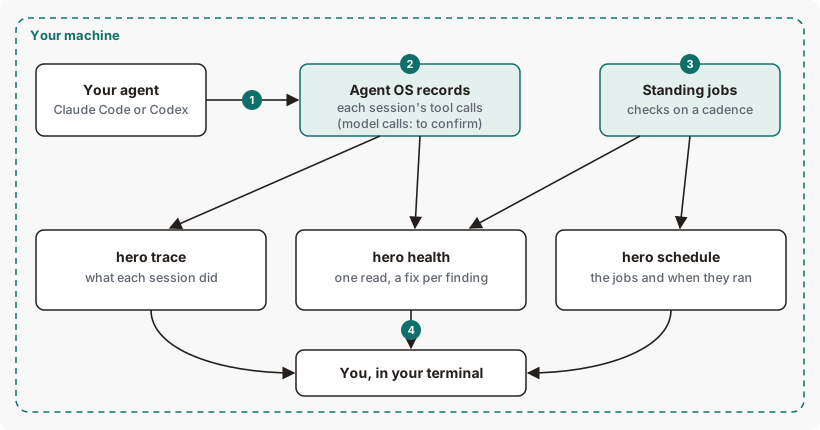
Get started with hero trace
Before you start: Agent OS is installed and you've run hero setup. With no sessions recorded yet, you'll see the first view under Example output.
See your recent sessions.
hero traceYou should see the window and a table of sessions, problems first, or a line asking you to use Claude Code or Codex as you normally do.
See every session in the window.
hero trace listYou should see the newest 25 sessions, newest first, ending with
newest first · replay one: hero trace show <session> · job results: hero verdict.Check for policy violations.
hero trace violationsYou should see the newest violations, or a line saying none were recorded. See Example 2.
Replay one session. Use the id the
Run:line names.hero trace show <id>You should see that session's steps in order. See Example 1.
Nothing here changes your work, so there's nothing to undo.
Example output of hero trace
Before any sessions are recorded
Example output. The format is the command's; the numbers are examples.
With recorded traces, from sample data
Example output. The format is the command's; the numbers are examples. Sample data: two Agent OS job traces with no model calls, not agent sessions, so session and agent read — and the id in the Run: line is a sample id.
A session with model calls shows its tokens and estimated cost in the last column, and the totals line adds tokens and cost. For Claude Code and Codex sessions, the session column holds the agent's own session id and the agent column says claude or codex; see Example 3. Sessions are told apart by their session id.
How to read hero trace output
| Line | What it means | Where it comes from | What to do |
|---|---|---|---|
| 1, 3. Window | The rolling 30 days the view covers, in UTC. | Your local session record. | Use hero trace list --all to show all sessions read within the 30-day window, or hero trace show <id> to replay an older session still in the trace store. |
| 2. No sessions yet | No session has been recorded in the window. | Your local session record. | Use Claude Code or Codex, then run this again. |
| 4. Totals | Sessions, tool calls, model calls, failed and refused steps in the window. Held, blocked, flagged, asked-you, tokens and cost are added only when they aren't zero. | Your local session record, priced on the rate card. | If a count of problems isn't zero, replay the session the Run: line names. |
| 5. Table header | One row per session. | Your local session record. | No action is required for the table header; it labels the session details below. |
| 6. A session | when: when the session started, MM-DD HH:MM. A longer session can show its start and end, such as 11-06 00:00–01:58. session: the agent's own session id, or — for a job with none. agent: the agent that ran it, or —, followed by its Agent OS identity in short form, such as agp_4007…89cc, or id not recorded, no id enrolled or id unreadable. steps: tool calls with their names, and model calls. outcome: ✓ ok when Agent OS recorded no failure, refusal, hold, block or flag; otherwise the count, such as ✗ 1 failed. tokens · cost: from the session's model calls, or — no model calls. | Your local session record. | Replay it with hero trace show <id>. |
| 7. Run | The first session worth opening. Shown by status only. | The report. | Run it. |
| 8. Footer | How many sessions are shown, in what order, and the commands for all sessions, one replay and job results. | The report. | Use hero trace list for more sessions. |
More hero trace examples
Example 1. To replay one session
hero trace show <id>Sample output (simulated data). hero trace show claude-3cd63, a Claude Code session with one model call and one tool call. Lines are left out where you see …
  TRACE  session=claude-3cd63  ·  2 step(s)  ·  ✓ OK  ·  2026-11-08 14:23:06 UTC
  ───────────────────────────────────────────────────────────────────────────
  session  claude-3cd63
  agent    identity not recorded
  harness  claude
  actor proxy  ·  model claude-sonnet-5  ·  elapsed 25.55s

  step  t+            dur  stage    recorded
     1  +0.000s    25.55s  request  provider anthropic
     1  +0.000s            route    model claude-sonnet-5 · class code
     1  +0.000s            govern   ✓ allow · rule not attributed
     2  +0.000s    40.0ms  tool     agent:Bash ran
  …
     1  +0.000s    25.55s  outcome  ✓ ok · surface claude
     2  +0.000s    40.0ms  outcome  ✓ ok · surface claude · agent:Bash

  action allowed yes
  task completed unknown · task verified unverified
  batch attested no
  …

  1 tool call(s)  —  All clean.
  …
The header names the session, then three lines say who ran it: session, the agent session id; agent, the full Agent OS identity of the agent (agp_ and 32 hex characters), or no agent identity enrolled (hero identity enroll), agent identity could not be read when recorded or identity not recorded; and harness, claude or codex. Each step shows its stage: the model request, the route it took, the governance decision, the tool call and the outcome, with the agent named on the outcome lines, such as surface claude. task completed and task verified are about the job, which hero verdict checks; they're separate from whether each step ran. On the route line, the decision is in words, such as kept the requested model, cheapest model that fits or routing off, and on the request line the credential reads, for example, your own signed-in subscription or your own API key.
Add --details to also print the raw span list, the line naming the record it read and the rate card version. Without it, a session with priced model calls ends with a prices: line naming the price basis.
If the id isn't found, it refuses with exit code 2. See the error.
Example 2. To see policy violations
hero trace violationsExample output. The format is the command's. Before any policy checks are recorded.
trace violations — none recorded — unavailable: no policy-checked traces observed yet (no verdict)This means no policy check has run, not that everything passed. With no session record at all, it prints trace violations — none recorded — unavailable: no trace store yet, nothing observed (no verdict).
Output from version 0.1.36rc13, from a home with sample data. Trimmed where you see …
trace violations — newest 15 policy violation(s)

  ✗  2026-11-07T00:04:28Z  anthropic/claude-sonnet-5
       id: demo-seed-ba588b3ff1834ee424e16828

  ✗  2026-11-06T08:29:34Z  anthropic/claude-sonnet-5
       id: demo-seed-d655d68a1410b27652ca1d33
  …
Each violation shows when it happened, the model, and an id.
Example 3. To see every session
hero trace listIt prints the same table as the default view, titled Trace · every session · rolling 30d, newest first, with no Run: line. Before any sessions are recorded, it prints that title and the same line as the default view. Add --all for every retained session. With more than 25 sessions in the window, the title reads Trace · newest 25 sessions and the footer names hero trace list --all.
Sample output (simulated data). Claude Code and Codex sessions over 30 days. Lines are left out where you see …
Trace · newest 25 sessions · rolling 30d (Oct 09–Nov 08 UTC)
  …
  ┌───────────────────┬──────────────┬────────┬──────────────────────────┬────────────┬────────────┐
  │ when (UTC)        │ session      │ agent  │ steps                    │ outcome    │ tokens ·   │
  │                   │              │        │                          │            │ cost       │
  ├───────────────────┼──────────────┼────────┼──────────────────────────┼────────────┼────────────┤
  │ 11-08 14:23       │ claude-3cd63 │ claude │ 1 tool (Bash) · 1 model  │ ✓ ok       │ 20,200 ·   │
  …
  ├───────────────────┼──────────────┼────────┼──────────────────────────┼────────────┼────────────┤
  │ 11-08 10:38–11:26 │ codex-3cd61  │ codex  │ 5 tools (Read, Grep,     │ ✓ ok       │ 9,335 ·    │
  …
  ├───────────────────┼──────────────┼────────┼──────────────────────────┼────────────┼────────────┤
  │ 11-07 06:11–06:53 │ claude-3cd53 │ claude │ 11 tools (Edit, Grep,    │ ✗ 1        │ 17,197 ·   │
  …
  └───────────────────┴──────────────┴────────┴──────────────────────────┴────────────┴────────────┘
  14 problems not shown above · hero trace violations
  newest 25 of 70 sessions · all: hero trace list --all · replay one: hero trace show <session> · ~
    means estimated at public API list prices · job results: hero verdict
Each row is one session. session is the agent's own session id, which you pass to hero trace show, and agent is the agent that ran it, claude or codex, with its Agent OS identity in short form.
Example 4. To use the record in a script
hero trace --jsonIts data holds headline, sessions, sessions_selected, last_verdict and next_step, then agent_sessions, one entry per session with its tools, model calls, problem counts, tokens and cost, and jobs, one entry per job with its outcome.
Exit codes and errors for hero trace
| Code | Meaning | What to do |
|---|---|---|
0 | The output asserts a positive result, or is advice with no verdict. The empty state exits 0. | Nothing. |
1 | A truthful negative result. | Read the output. |
2 | Refused: unknown flag or subcommand, not configurable, a missing or unknown id for show, or an unreadable record for violations. | Read the reason and governing_rule lines. See the errors below. |
3 | A source it needs is unavailable at runtime, such as a damaged session record for status, list or show. | See the errors. |
A refusal prints refused, reason and governing_rule lines (or the same keys with --json).
| Error | Cause | Fix |
|---|---|---|
trace has no verb '<word>' | An unknown subcommand. Also printed for the short form when the id isn't lowercase hex and dashes, such as hero trace trace-2. | Use hero trace show <id>. |
trace has no flag '<flag>' | An unknown flag. | Check the synopsis. |
trace is not configurable | An attempt to switch hero trace on or off. | None. Recording needs no setting. |
trace show needs <trace_id> | show was run without an id. | Add an id from hero trace. |
no trace or job '<id>' in the trace ledger | No session, trace or job has that id. | Run hero trace list and copy an id. |
no trace or job '<id>' — no trace ledger yet | No session has been recorded on this machine. | Use Claude Code or Codex, then try again. |
'<prefix>' matches more than one trace or job — pass a full id: <id>, <id> | The prefix matches several ids. | Pass one of the full ids listed. |
<file> is present but cannot be read | The session record on your machine is damaged. Exit code 3. | Email support at the address in your welcome email. |
trace_corrupt — Trace source degraded; no content was read | The same damage, met by violations. Exit code 2. | Email support at the address in your welcome email. |
Your trace history is larger than this build can read at once (over 64 MB). Recent traces are still recorded; large-history reading is coming. | The session history on your machine is over 64 MB. Exit code 3. | There is no supported fix for this. Recent traces are still recorded. |
Files and environment for hero trace
| Name | Kind | Purpose |
|---|---|---|
HERO_HOME | Environment variable | Root of Agent OS's files on your machine, including the session record. Default ~/.hero. |
HERO_BILLING_RATES | Environment variable | Path to your own rate card. Cost figures use it. Without it, cost is at public list prices. See Use your own rates. |
Limits of hero trace
| Limit | Behaviour | Can you change it? | What to do |
|---|---|---|---|
| Window | The table and --details cover 30 days. show reaches any retained trace. | No | Use hero trace show <id> to replay an older session still in the trace store. |
Rows in list | The newest 25, unless you add --all. | Yes | Use hero trace list --all. |
| Large trace history | Over 64 MB, hero trace refuses with exit code 3. New sessions are still recorded. | No | There is no supported fix for this. Recent traces are still recorded. |
| Real sessions | Tool calls are recorded as your agent works. | No | See which model served each call in hero route. |
Failures and violations | violations lists policy violations only, not failed steps. A session that failed can point you to violations, which then finds nothing. | No | Replay the session with hero trace show <id>. |
| Short form | hero trace <id> works only for ids made of lowercase hex digits and dashes. | No | Use hero trace show <id>. |
Commands related to hero trace
Checked against Agent OS 0.1.36rc14 (build 599c5e120c18) on 17 Nov 2026.